
 DESCRITPION
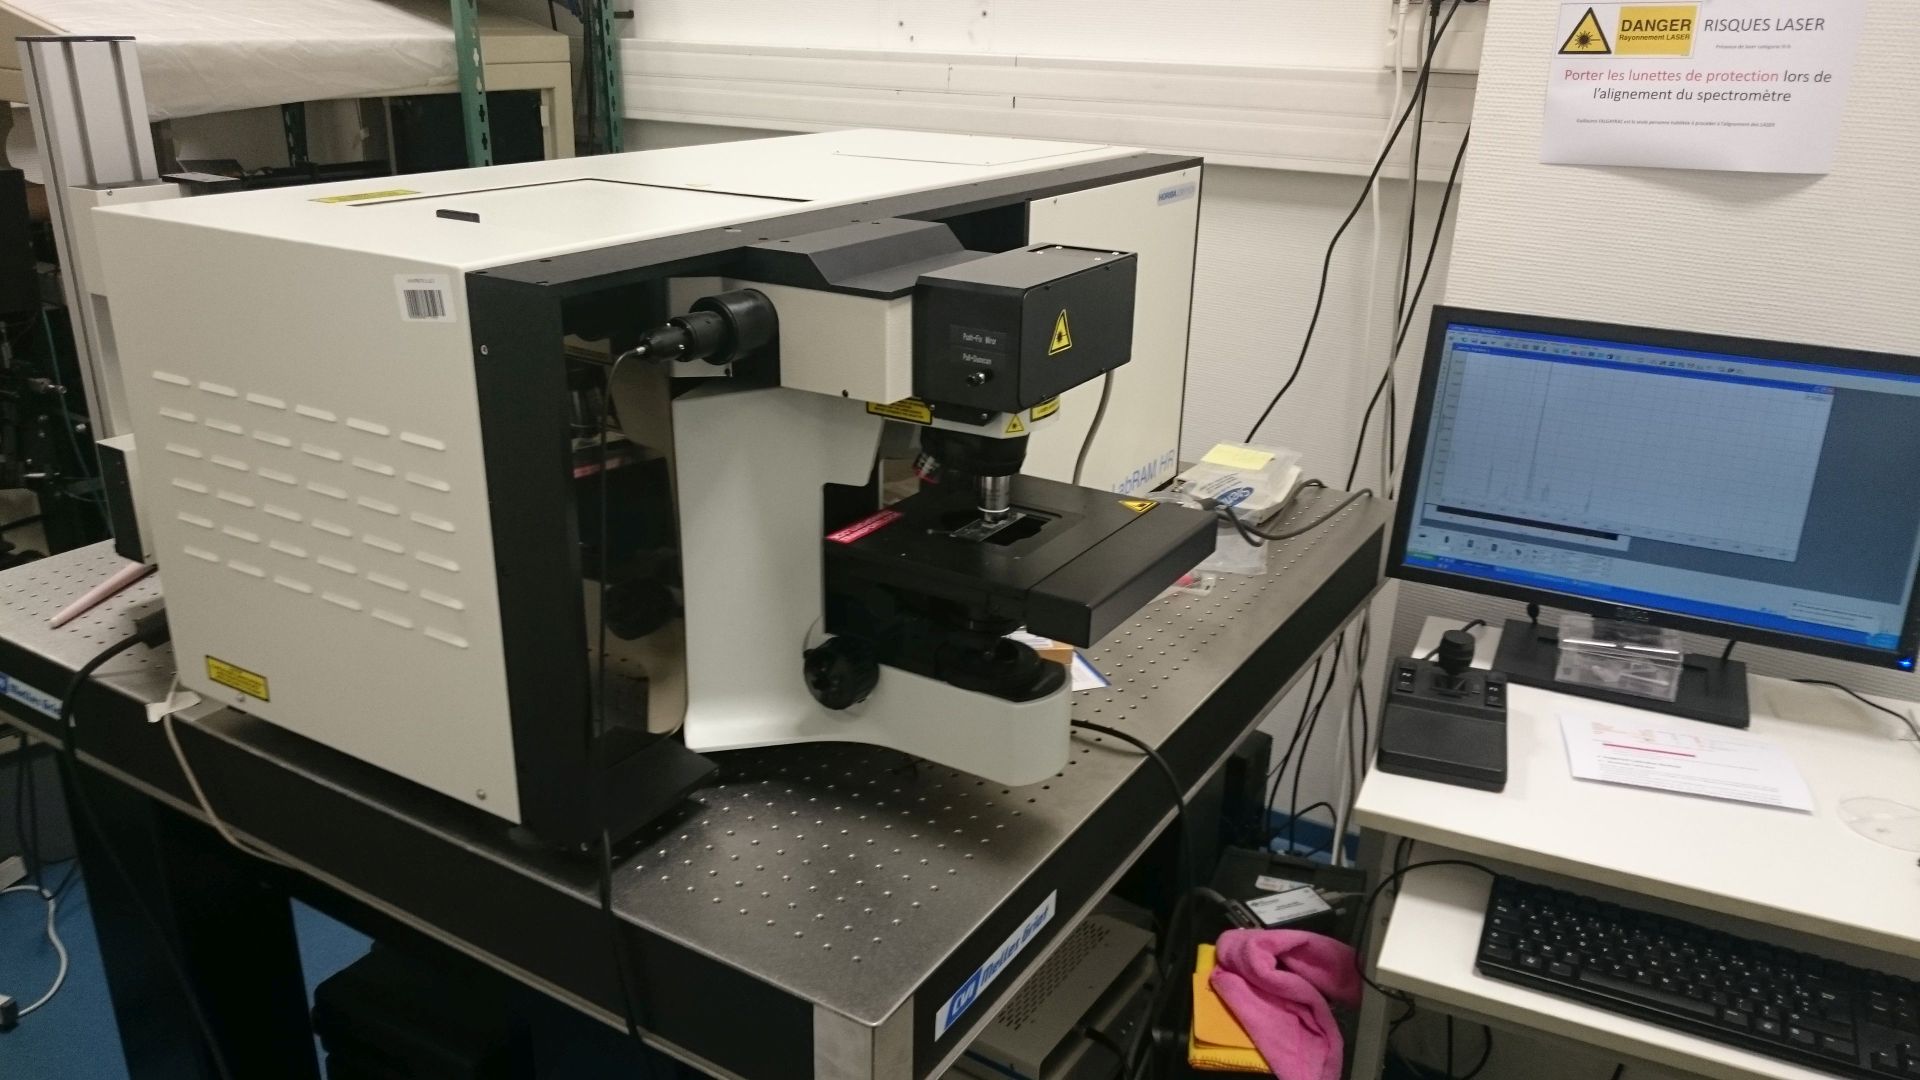
We work with a LabRAM (HR 800), HORIBA Jobin-Yvon (France). Raman microspectrometer have a lateral resolution of 1 µm² and the analysis is non-desctructive. Raman spectroscopy allows to analyze the molecular composition of the sample.
Contact: Guillaume FALGAYRAC
SAMPLES:
We developed expertise in the analysis of calcified tissues and cells.
For bone samples, the microspectrometer permits to work on fresh or embedded bone samples. We use Polymethyl Metacrylate resin to embed samples. When it is possible, we use florescent marker to localize newly formed bone compared to old formed bone. We use fluorescent markers in animals models for example.
For cells culture of osteoblast or adipocytes, we use an immersion objective. The cells are prepared on CaF2 substrates which are adapted to the Raman analysis. The Raman analysis allows the evaluation of the molecular composition of the mineral and the extracellular matrix formed by the osteoblasts.
DATA TREATMENT & ANALYSIS
Since many years, the physico-chemical parameters has become a standard to evaluate the bone quality. We developed functions under Matlab to calculate the physico-chemicals parameters specifics to the mineral and organic material (mineral/organic ratio, type-B carbonate ratio, crystallinity, collagen quality, crosslinks, proteoglycan content). These parameters allows to evaluate quantitatively the modifications of bone composition. These parameters are also related to the biomechanic properties of bone. For example, we used Raman analysis to evaluate the effect of ostenecrosis of the jaw on the molecular composition of bone.
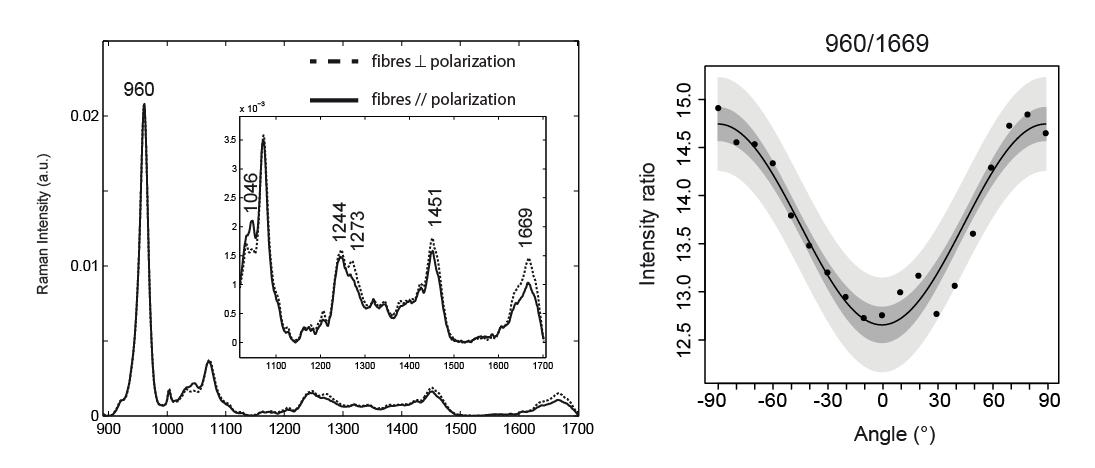
We developed expertise in multivariate analysis, especially in Principal Component Analysis and Partial Least Square Discriminant Analysis. We also analyse the structure of mineralized collagen fibres with polarized Raman spectroscopy. Polarized Raman spectroscopy allows to determine the molecular orientation of the crystal of hydroxyapatite and collagen fibers.
EXAMPLES
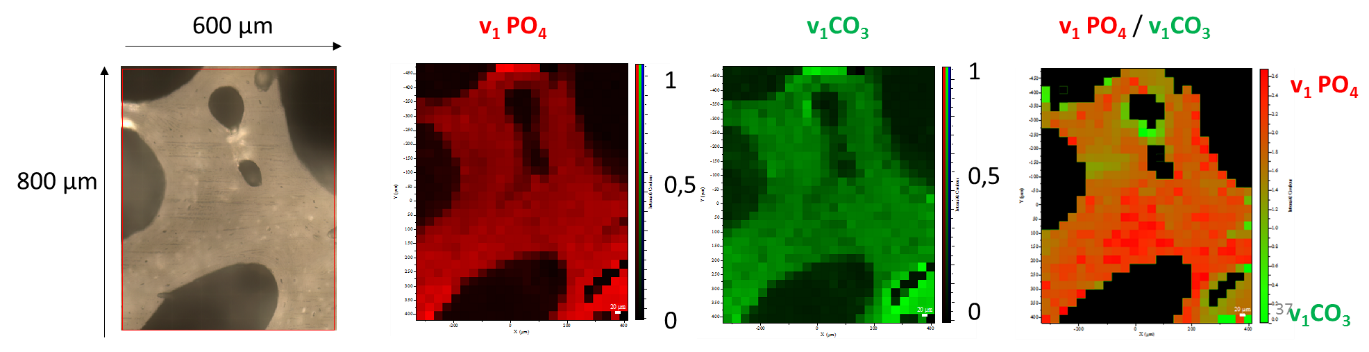
- Raman imaging using DuoScan technology: spatial distribution of type-B carbonate content of a large area (600×800 µm²) acquired in 4h with a pixel resolution of 30 µm.
- Polarized Raman spectroscopy: variation of the relative intensity as function of the orientation of the mineralized collagen fibres. These results allows to identify the preferential orientation of the mineralized fibers.
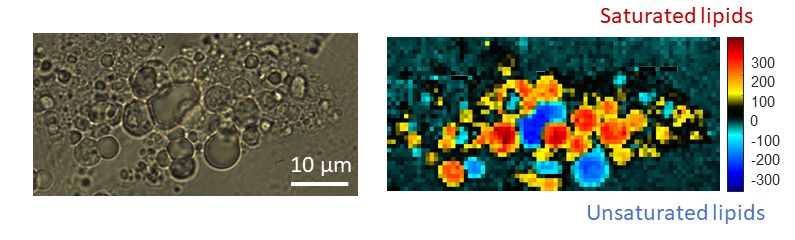
- Raman imaging of adipocytes: The image on the left represents the optical image seen through the microscope. The image on the right represents the corresponding Raman image. The Raman image represent in red the lipid droplet composed of saturated lipids and in blue, the lipid droplets composed of unsaturated lipids. The Raman analysis allows to evaluate the hetoregenity of the composition of the adipocytes. Further examples in Tratwal et al , 2022.